Finviz Plots
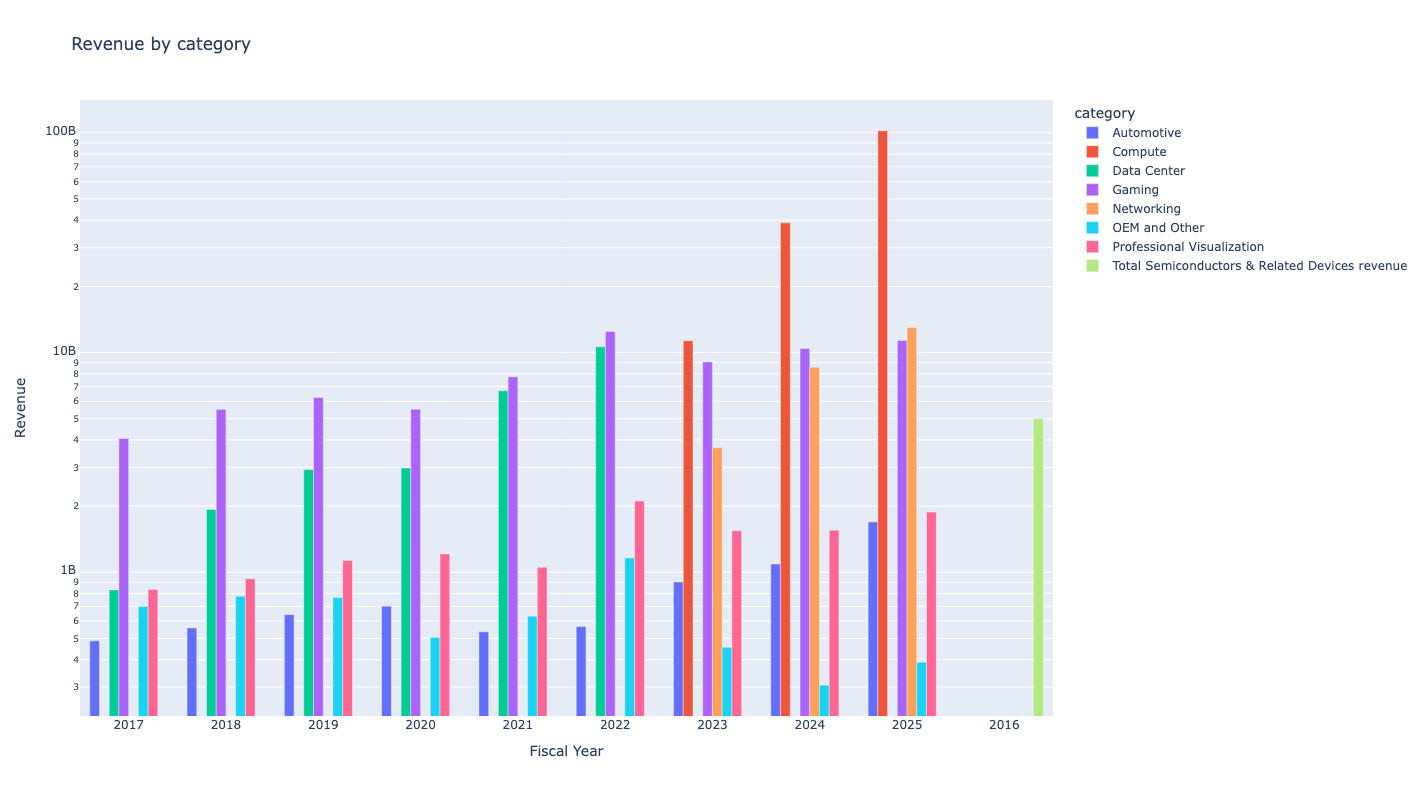
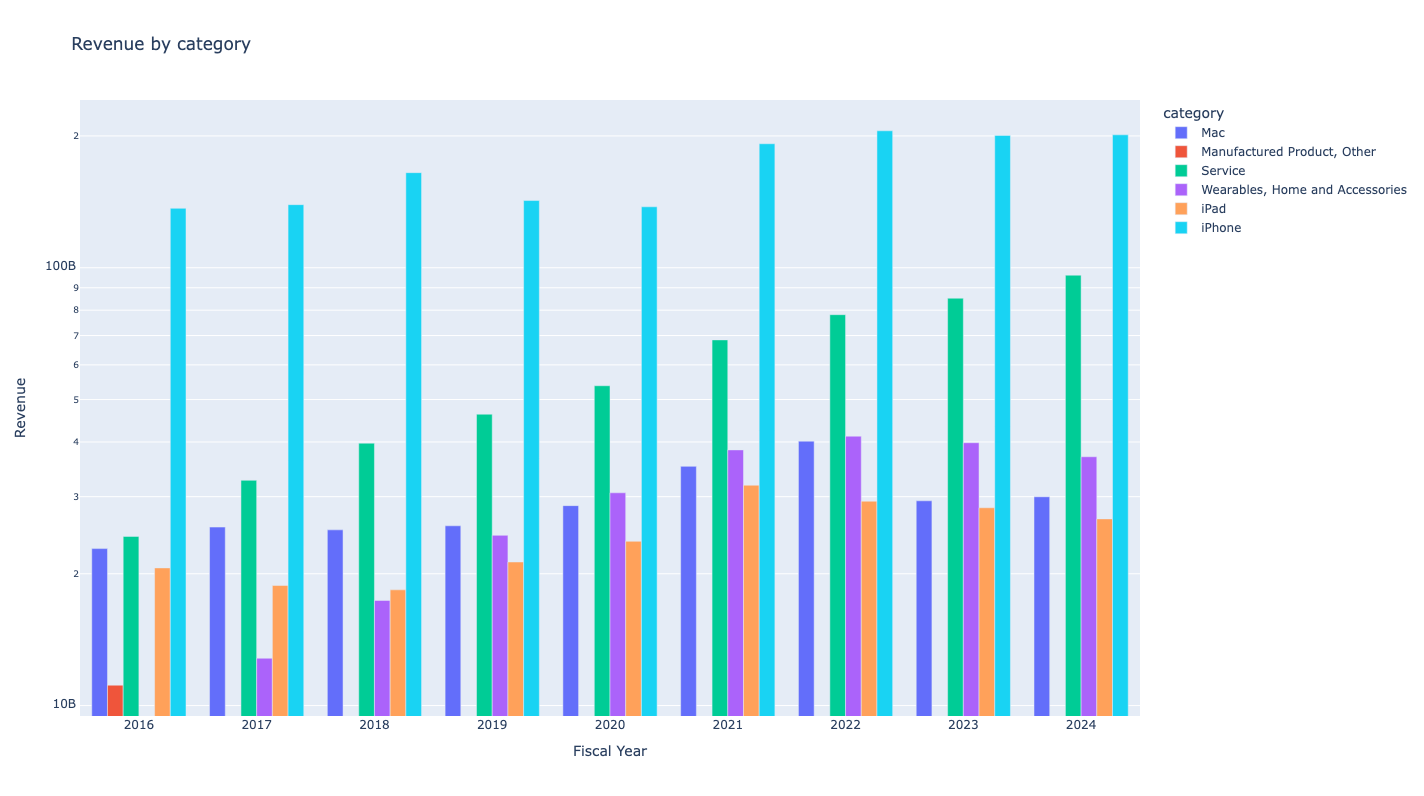
Grouped bar charts of revenue broken down by product, segment or region,
from Finviz. Each takes logarithmic (bool) to use a log scale on the
y-axis, which helps when one category is much larger than the rest.
Revenue by Products and Services
from stockdex import Ticker

ticker = Ticker(ticker="AAPL")
ticker.plot_finviz_revenue_by_products_and_services(logarithmic=False)
Revenue by Segments
from stockdex import Ticker

ticker = Ticker(ticker="AAPL")
ticker.plot_finviz_revenue_by_segments(logarithmic=False)
Revenue by Regions
from stockdex import Ticker

ticker = Ticker(ticker="NVDA")
ticker.plot_finviz_revenue_by_regions(logarithmic=True)